
Beside the images, bloggers often want to present the statistics under the charts and graphs to help readers access easier. According to the default settings of WordPress in general and WordPress education themes particularly, it is impossible to create charts or graphs but there are some codes, plugin or API library to enable the users to insert the interactive charts and graphs. Some people like to use the simple method such as setting up and using plugin while some prefer using codes or API. Therefore, depending on design requirements, you can choose the suitable one.
The list below provides you six methods to insert charts and graphs into WordPress in general and WordPress themes on education in particular.
ChartBoot for WordPress
This is a useful plugin for inserting the available graphs of Google into the WordPress generally and WordPress themes on education in particular. Thanks to it, you can directly create or edit the graphs of Google from the inside of dashboard. You can input the data for the graphs from Excel and then insert into the WordPress education themes after completing the settings. You can also choose the position for the graph by copying and pasting its shortcode to the appropriate chart.
Easy Graphs
This plugin is quite flexible in creating bar, line and pie; meaning that its shortcode can accept detailed specifications for data and other information in order to create a complete one. If you want to compare two values of the data on the same pie chart, this plugin will be a great choice.
JSXGraph – Graphics with JavaScript
If you want to insert the geometric charts into the WordPress or WordPress education themes, you should choose this plugin. All charts in the plugin can automatically update the data. It is extremely useful for education websites as it help students insert the charts into the post more conveniently.
Google Docs Spreadsheet Charts
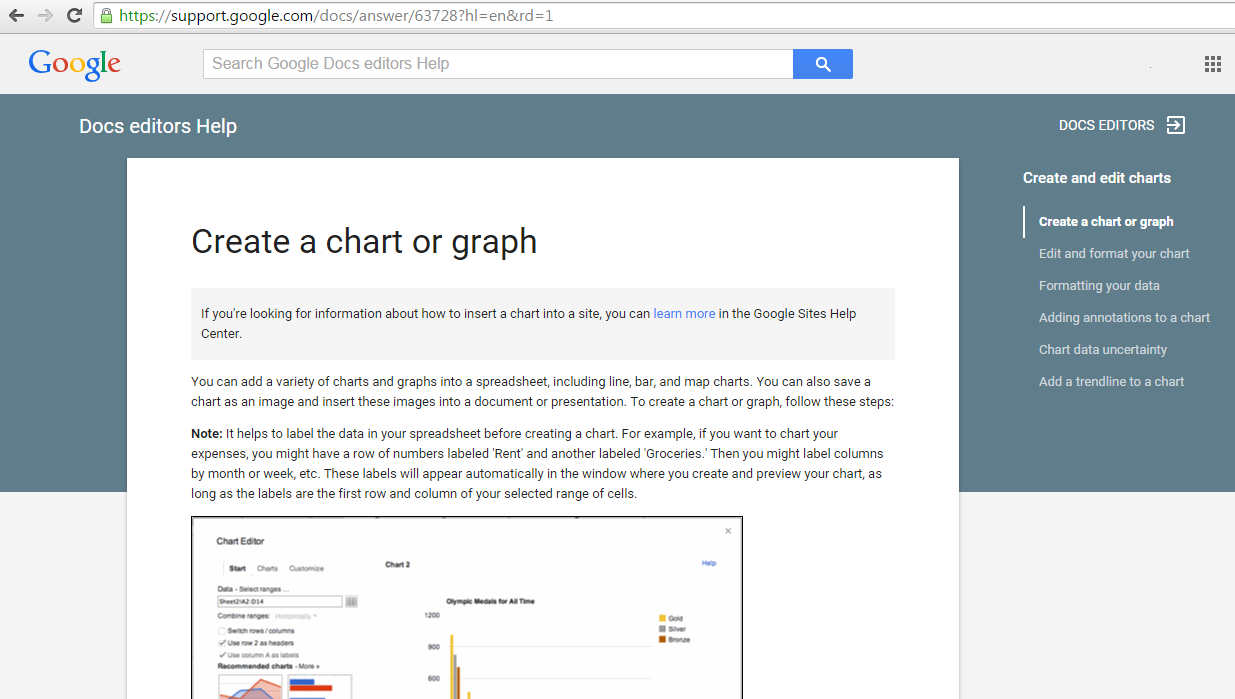
You can also use Google spreadsheet to create charts for WordPress themes on education. To take the data, you need to press Publish chart after input. The chart is directly linked with Google Docs Spreadsheet Charts and automatically updated when the data is modified. This method is effective, reliable and highly recommended when doing surveys with the ever-changing data.
Easy Chart Builder
This plugin provides you an easy and direct way to create charts. You can edit the size for the chart to make it fit with mobile themes (Interactive with Responsive Theme). You can also insert charts into widget areas and custom pages.
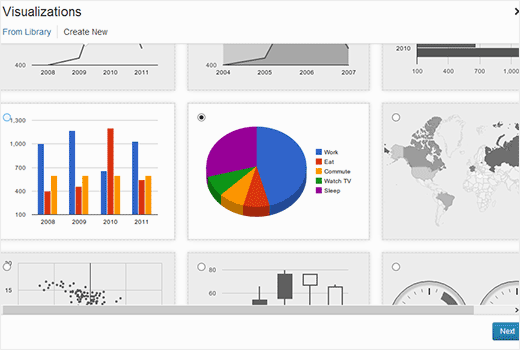
Google Visualization Charts
It is an ideal plugin for different charts. You can directly enter the information of the chart into a shortcode and set it up in the suitable position in the WordPress site. After activated, Google Visualization Charts will automatically fetch the API code of Google to create charts. Moreover, the plugin supports a size adjustment feature which helps your charts look great on mobile phones and tablets.